Data Visualization And Business Intelligence

Data Visualization and Business Intelligence solutions at OutsourcingWise turn complex data into clear, interactive insights that drive smarter business decisions and strategic growth.

A dashboard that nobody trusts, or nobody understands, does not help a decision. Outsourcingwise Data Visualization and Business Intelligence Training teaches teams to turn raw data into clear, boardroom-ready dashboards using Power BI, Tableau and AI-assisted BI tools.

The focus is on what leaders need to see and how to show it, not just which buttons to press.

Course Objectives

  • Apply visualisation and data storytelling principles so that dashboards lead to decisions
  • Connect, clean and model data from several sources
  • Build interactive dashboards and reports
  • Define KPIs and measures that match the questions leadership asks
  • Use AI-assisted BI features to speed up analysis

Who Should Attend

  • Finance, operations and sales analysts
  • Reporting and BI teams
  • Managers who consume dashboards and want to specify them better
  • Teams moving from static Excel reports to interactive reporting

Course Outline

  • Module 1 — Visualisation and storytelling principles: choosing the right chart for the question
  • Module 2 — Connecting and preparing data: combining sources into one reliable model
  • Module 3 — Building dashboards: hands-on in Power BI [and Tableau: confirm]
  • Module 4 — KPIs and measures that matter: aligning metrics to decisions
  • Module 5 — AI-assisted BI: natural-language questions and automated insights [confirm tools]
  • Module 6 — Presenting to the boardroom: walking leaders through a dashboard with confidence

Format and Duration

Delivered onsite in Singapore, virtually or hybrid. Typical duration: Customised for organisation needs. The outline is adjusted to your tools, data and team’s level after a discovery call, and every participant receives a certificate of completion.


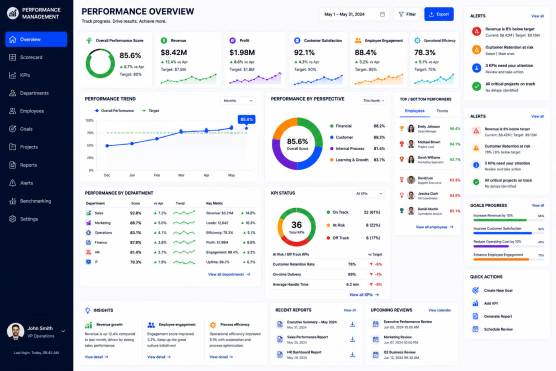
Performance management Dashboards

Performance Management Dashboards at OutsourcingWise deliver real-time insights into key business metrics, helping organizations track goals, measure performance, and improve decision-making.
We turn complex data into clear, actionable visuals that drive efficiency, accountability, and continuous business growth.

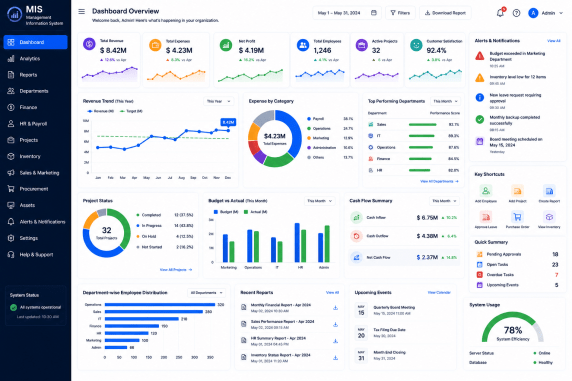
Management information system (MIS)

At OutsourcingWise, our Management Information System (MIS) solutions help businesses organize, process, and analyze data for effective decision-making. We design customized MIS reports that provide accurate, timely, and structured information across all business functions. Our systems improve operational efficiency by delivering clear insights into performance, productivity.

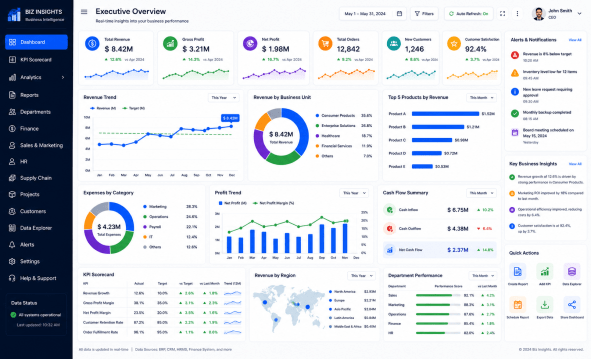
Creating Business Intelligence Dashboards

At OutsourcingWise, we specialize in creating powerful Business Intelligence dashboards that turn complex data into clear, actionable insights.
Our dashboards provide real-time visibility into key business performance metrics across sales, finance, and operations.
We design interactive and user-friendly visual reports to help you track .

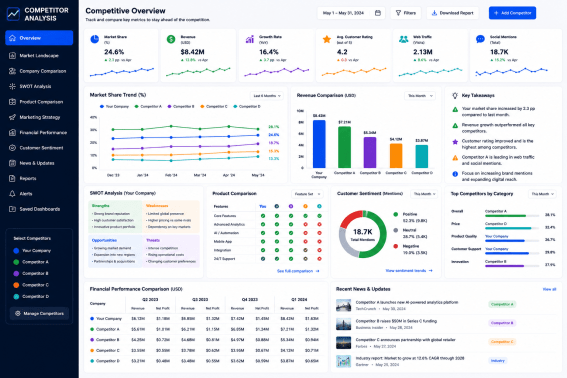
Competitor Analysis

At OutsourcingWise, our Competitor Analysis services help businesses understand their market position and identify key opportunities for growth.
We analyze competitors’ strategies, strengths, weaknesses, and digital performance to uncover actionable insights.
Our data-driven approach helps you stay ahead by improving your marketing, pricing, and product strategies.

Sales & Revenue Analysis Dashboards

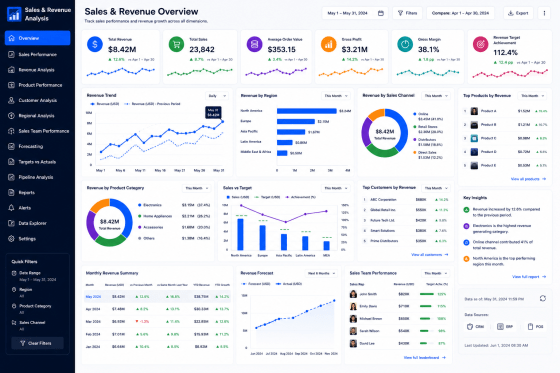
At OutsourcingWise, our Sales & Revenue Analysis Dashboards are designed to give businesses a clear and real-time view of their sales performance and income trends.

We convert complex sales data into simple, interactive dashboards that help organizations track revenue streams, monitor targets, and evaluate overall business growth with ease.

Our dashboards integrate data from multiple sources such as CRM systems, ERP platforms, and sales databases to provide a unified and accurate picture of business performance.

With advanced visualization tools, businesses can analyze product-wise sales, regional performance, customer behavior, and monthly revenue trends in a single, easy-to-use interface.

By leveraging our Sales & Revenue Analysis Dashboards, companies can make faster and more informed decisions, identify high-performing products and markets, and improve forecasting accuracy.

Common Questions About Our Services

Whichever your organisation already uses or plans to adopt. We train on the tool that fits your environment, and the design principles apply to both.

No. Data preparation is part of the programme, using your own or realistic sample data.

This programme covers dashboard design and BI across tools. Power BI Training is a dedicated, tool-specific course covering modelling, DAX and publishing.

Yes. Our Dashboard Creation Services and Power BI Solutions build dashboards for you, and we can then train your team to maintain them.

Data Visualization And Business Intelligence

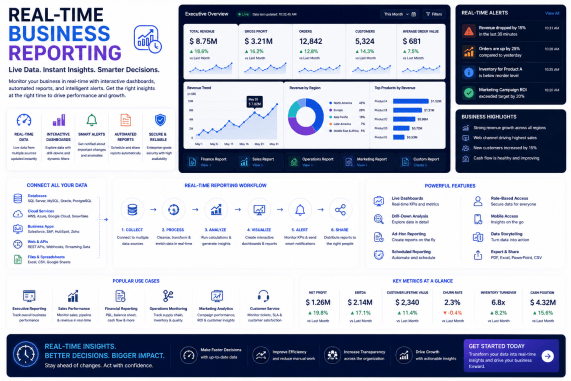
At OutsourcingWise, our Data Visualization and Business Intelligence solutions transform complex data into clear, interactive, and actionable insights that drive smarter business decisions.

We design intuitive dashboards, real-time reporting systems, and advanced BI tools that help organizations monitor performance, identify trends, and uncover growth opportunities with ease.

Contact Us